2014 - My Quadrant Score (OCed 1.2Ghz, Virtual EXT4 partition as /data/data)
With the recent explosion of high-end Android devices hitting the market on all of the various carriers, it seems that the benchmark app Quadrant has become the ‘standard’ to test out and compare these new ‘superphones’, and to see how fast we can tweak them using mods, hacks, or other related improvements. Having just upgraded to a Samsung Vibrant myself, I too have found myself falling victim to this “benchmark fever”, relentlessly trying to squeeze every last benchmark point out of my already-speedy device, through the use of optimized kernels, overclocking, “lag fixes”, and other misc tweaks.
With my background in repairing and optimizing PCs for gaming and video editing, I knew the importance of a reliable and reproducible benchmark. Without one, you can optimize, tweak, and tune all you want, but in the end, you will have no idea if you had any impact on overall performance. Likewise, without some kind of baseline to compare against, or a “control group” for your scientific method enthusiasts, the ‘scores’ being produced are completely useless, as you have nothing to compare them against. In this case, Quadrant provides several baseline scores for several popular Android phones to compare your score against.
My question of Quadrant’s reliability first started when I applied a few of the “lag fixes” found in the XDA-Developers Forums. Prior to applying the mod, I was averaging ~900 in Quadrant Standard. After applying & testing a few of the “lag fixes”, I was averaging between 2100-2700. All of the “lag fixes” involved moving the app data and dalvik-cache away from Samsung’s slow internal Storage, which should only affect Input/Output scores in a overall system benchmark, but this test (see my score below) gave me over 2x the score, raising my score from ~900 to ~2100. For an general system benchmark, improving only one aspect of the system (I/O speed) should not raise the score exponentially, as it did. Within a few days, my finding were confirmed by a very reputable source, Cyanogen himself.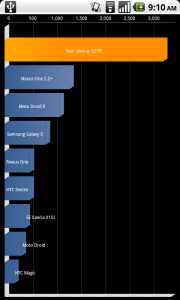
A recent tweet from Cyanogen included the Quadrant results to your right,and the following comment: ““Don’t rely on this stuff as your guide to how fast your phone is. There are a lot of other factorsâ€. In a subsequent tweet, Cyanogen explains that he was able to ‘cheat’  the benchmark by mounting, “a [temporary file system] over quadrant’s data directory”, which may artificially increase the benchmark results, making them unreliable and unrealistic. Many of the “lag fixes” for the Samsung Galaxy-S (Vibrant and Captivate included) are based on a similar concept, which mounts a “virtual” EXT partition on top of Samsung’s proprietary RFS file system,which  buffers the data and gives the increase in data access speeds.
Take a look at Quadrant scores below, one from Cyanogen and one from my own testing using Quadrant Advanced. Taking at look at my score, you can see that Quadrant Advanced breaks down the score to the individual areas of testing, and that green, which is I/O speed, takes up a large portion of my score. If this were an “accurate” system benchmark, my score would have only improved slightly, as only one area of my phone was tweaked (Think “a chain is only as strong as its weakest link”, or the slowest component). Seeing that my I/O scores takes up almost two-thirds of my overall system score reinforces the notion that Quadrant isn’t a very reliable system benchmark. Hopefully, Aurora Software can improve on how Quadrant calculates its scores to make it more balanced and accurate.
You can download Quadrant from the Android Market by clicking or scanning the QRCode below:

-

- 2014 – My Quadrant Score (OCed 1.2Ghz, Virtual EXT4 partition as /data/data)